Resumo do Relatório
FX Dashboard: In the Line of Fire – Impact on Central European Currencies from Russia’s Invasion
 (1 votes, average: 5,00 out of 5)
You need to be a registered member to rate this.
Earlier this week, the US dollar index (DXY) touched 99.4, the strongest level since March 2020. Even though it’s off the peak now, since the start of the Russian invasion of Ukraine on Feb 24, the dollar has strengthened by 1.8%. This is consistent with my view that in the near term the dollar should remain strong, with a risk of further appreciation – see The US Dollar View and Its Implications for EM Currencies. Overall, my view is the current environment is not supportive of EM currencies broadly.
As expressed in Contagion Risks from Russia to Other EM Currencies, the headwinds to EM currencies increased following Russia’s attack. Indeed, since Feb 24, EM currencies have depreciated by 1.8% on average for 21 currencies, which is in line with the historical beta of slightly below -1 to the US dollar. If the dollar revisits its peak, the risk is the pace of depreciation for EM currencies increases beyond its historical beta.
Of the EM currencies, the worst hit are from Central European (CE) countries. As the chart below shows, these currencies have considerably outpaced the sell-off in broad EM, even when looking at the cross against the euro.
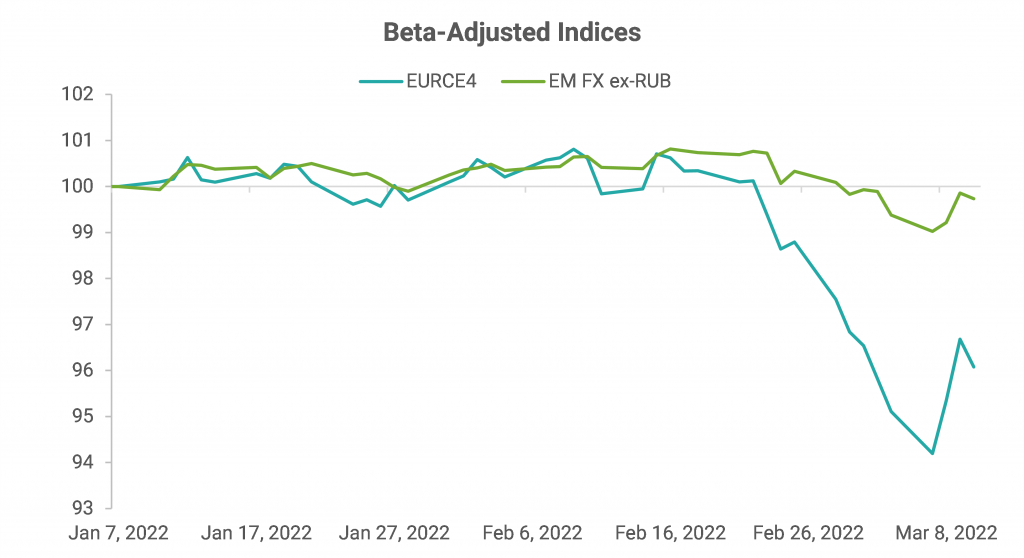
Data Source: Refinitiv; Note: EM FX is equally weighted indices of spot returns of 21 currencies; EURCE4 is an index of CE4 currencies against the euro
Parsing the performance by currency since the start of the invasion, the CE currencies stand out as the worst performers along with the Turkish lira (TRY) – see the charts below. The drivers behind this underperformance are:
- Euro under pressure: CE currencies tend to follow the euro as they are closely interlinked with the eurozone via trade. The euro, meanwhile, has weakened as should be expected with the US dollar strengthening. However, there are other reasons to expect that the euro may remain under pressure:
- Global economic growth to suffer, led by Europe: After softening towards the end of 2021, the European economy showed signs of a strong bounce this year, as evidenced from the Euro area February economic sentiment and Germany’s January industrial production data. Looking ahead though, both activity and confidence readings are likely to drop due to the uncertainty about the duration and impact of the war, with the European countries the most vulnerable due to their proximity. It’s too early to estimate the magnitude of the impact, but the direction is clear.
- Inflationary risk, again led by Europe: A direct result of the war has been a sharp increase in commodity prices, particularly oil following the ban of imports from Russia by the US. Prices of other commodities, including wheat and nickel, have also risen sharply as either Russia or Ukraine or both are important exporters. Some of the price increases are the result of sanctions while others are due to supply issues. The price increases are large enough to result in demand destruction, hurting economic activity further, especially in Europe which is a major commodity importer.
- Risk of direct conflict: NATO has been careful to not get directly involved in the war, even though they have actively supplied weapons to Ukraine and are accepting refugees from there. However, President Putin’s exact motives behind the invasion are unclear, which makes it difficult to rule out his intentions of a deliberate escalation by attacking one of the NATO countries, especially since the war is faring badly for Russia and its economy is getting crushed by the sanctions. Even if there is no deliberate attack, the risk of an accidental or unintentional escalation cannot be ruled out.
The European and CE authorities have taken a few steps to try and mitigate the impact on their economies and currencies:
- EU joint bond sale: According to Bloomberg, the EU is debating issuing a joint bond to finance the increased energy and defense needs of the region as a direct result of Russia’s invasion. Issuing a mutual bond would help alleviate the impact on the regional economy from the increase in commodity prices.
- Rate hikes: Poland’s central bank delivered an upside surprise with a 75 bp rate hike at its meeting this week. The move led to an increase in rate hikes priced in the curve. Hungary’s central bank followed a 50 bp base rate hike at a meeting just before Russia’s attack with a greater-than-expected 75 bp increase in the one-week deposit rate, which is the de facto policy rate and allows for quick adjustments in interest rates.
- FX interventions: Central banks have also stepped up currency interventions with Poland, Hungary, and Czechia intervening multiple times in recent days. With sufficient international reserves, the interventions can continue as necessary.
- Swap lines: Poland’s central bank is seeking foreign currency swap lines with the ECB, Fed, and SNB as a precautionary measure.
- Exports ban: Hungary has banned grain exports effective immediately to compensate for the loss of wheat imports from Russia and Ukraine.
These steps will deliver what is intended – mitigating the impact on their currencies. Ultimately, the magnitude of the impact will be a function of the duration and intensity of the war, which is difficult to predict. Nevertheless, a risk premium needs to be in place in the euro and the CE currencies for the time being.
I have currently two outstanding trade recommendations in the region: Long Hungarian forint (HUF)/Short Czech koruna (CZK) and Receive Poland 10y (PLN 10y) vs Pay Eurozone 10y (EUR 10y) local rate (see here and here). Both trades have been affected by recent developments. Nonetheless, keeping regional hedges has reduced the impact. For now, I continue to recommend holding both trades.


Data Source: Refinitiv; Note: EM FX = equally weighted index of spot returns of 21 currencies
Best Longs / Best Shorts
- To the list of underperformers based purely on my models in the attached FX Dashboard pdf, I added Polish zloty against the euro (EURPLN) and Korean won (KRW) as their z-scores crossed 1.
- The list already had Israeli shekel (ILS), Hungarian forint against the euro (EURHUF), the Philippine peso (PHP), and the Taiwan dollar (TWD) on it.
- On the list of outperformers, I replaced Thai baht (THB) with Chilean peso (CLP).
- The list already had Peruvian sol (PEN) and Brazilian real (BRL) on it.
Best Crosses
- The list of the preferred relative-value trades based purely on my models changed to Short BRL vs Long ILS or Hungarian forint (HUF) or Polish zloty (PLN) and Short PEN vs Long ILS.
- The 3m expected returns for these pairs are in the range of 14-16% (not annualized), assuming mean reversion.

Gautam Jain
Estrategista - Ph.D, CFA
New York, EUA
Aviso legal
DISCLAIMER: Este Relatório de Análise foi elaborado e distribuído pelo Analista, signatário unicamente para uso do destinatário original, de acordo com todas as exigências previstas na Resolução CVM nº 20 de 26 de fevereiro de 2021 e tem como objetivo fornecer informações que possam auxiliar o investidor a tomar sua própria decisão de investimento, não constituindo qualquer tipo de oferta ou solicitação de compra e/ou venda de qualquer produto. As decisões de investimentos e estratégias financeiras devem ser realizadas pelo próprio leitor, os Analistas, ou a OHMRESEARCH não se responsabilizam por elas. Os produtos apresentados neste relatório podem não ser adequados para todos os tipos de investidores. Antes de qualquer decisão de investimentos, os investidores deverão realizar o processo de suitability no agente de distribuição de sua confiança e confirmar se os produtos apresentados são indicados para o seu perfil de investidor. A rentabilidade de produtos financeiros pode apresentar variações e seu preço ou valor pode aumentar ou diminuir num curto espaço de tempo. Os desempenhos anteriores não são necessariamente indicativos de resultados futuros. A rentabilidade divulgada não é líquida de impostos. As informações presentes neste material são baseadas em simulações e os resultados reais poderão ser significativamente diferentes.
O(s) signatário(s) deste relatório declara(m) que as recomendações refletem única e exclusivamente suas análises e opiniões pessoais, que foram produzidas de forma totalmente independente e que a OHMRESEARCH não tem qualquer gerência sobre este conteúdo. As opiniões aqui expressas estão sujeitas a modificações sem aviso prévio em decorrência de alterações nas condições de mercado. O Analista responsável pelo conteúdo deste relatório e pelo cumprimento da Resolução CVM nº 20/21 está indicado acima, sendo que, caso constem a indicação de mais um analista no relatório, o responsável será o primeiro analista credenciado a ser mencionado no relatório. Os analistas cadastrados na OHMRESEARCH estão obrigados ao cumprimento de todas as regras previstas no Código de Conduta da APIMEC para o Analista de Valores Mobiliários e no Manual de Controles Internos para Elaboração e Publicação de Relatórios da OHMRESEARCH. De acordo com o art. 21 da Resolução CVM nº 20/21 caso o Analista esteja em situação que possa afetar a imparcialidade do relatório ou que configure ou possa configurar conflito de interesse, este fato deverá estar explicitado no campo “Conflitos de Interesse” deste relatório.
O conteúdo deste relatório é de propriedade única do Analista signatário e não pode ser copiado, reproduzido ou distribuído, no todo ou em parte, a terceiros, sem prévia e expressa autorização deste Analista. Todas as informações utilizadas neste documento foram redigidas com base em informações públicas, de fontes consideradas fidedignas. Embora tenham sido tomadas todas as medidas razoáveis para assegurar que as informações aqui contidas não são incertas ou equívocas no momento de sua publicação, o Analista não responde pela veracidade das informações do conteúdo.
Para maiores informações, pode-se ler a Resolução CVM nº 20/21 e o Código de Conduta da APIMEC para o Analista de Valores Mobiliários. Este relatório é destinado exclusivamente ao assinante da OHMRESEARCH que o contratou. A sua reprodução ou distribuição não autorizada, sob qualquer forma, no todo ou em parte, implicará em sanções cíveis e criminais cabíveis, incluindo a obrigação de reparação de todas as perdas e danos causados, nos termos da Lei nº 9.610/98 e de outras aplicáveis.