Resumo do Relatório
Rates Dashboard: How are Fed’s Rate Hikes Impacting EM?
 (1 votes, average: 5,00 out of 5)
You need to be a registered member to rate this.
In the US, inflation has taken over from employment as the most relevant data from the standpoint of financial markets. Yesterday’s CPI release was no exception. April CPI came in at 8.3% YoY and 0.3% MoM, higher than expected but lower than last month. Core CPI demonstrated the same pattern – worse than expectations but better than last month.
In the immediate aftermath of the release, US yields rose across the curve, with US 2y selling off by 10 bp. However, as it became clear that the sharp monthly jump in airfares and hotel prices was a big reason behind the miss, US yields started coming off the peak. As the day progressed, the sell-off in technology stocks worsened, which then led to a further rally in rates with the US 2y ending close to flat for the day.
The volatility of US yields was not just an intraday phenomenon. Indeed, the MOVE index has been close to its decade highs, barring the March 2020 peak. The high volatility of US rates is due to the uncertainty regarding the economic outlook:
- Will there be a recession in the US or globally?
- Will there be another spike in energy prices related to Russia’s ongoing invasion of Ukraine?
- Does the Fed continue to raise rates as it has outlined, or will it be forced to change its path?
- If it changes path, is it to hike more aggressively or less, tying to the first two questions above?
While these uncertainties remain, inflation in the US is at or close to its peak, even though the decline from here is likely to be gradual. The curve in the US is now pricing 3 rate hikes of 50 bp each followed by 2 rate hikes of 25 bp each for the rest of the year. Notwithstanding the uncertainties cited above, the Fed’s path is better defined now than a few weeks ago. As such, I expect the volatility of rates to peak in the coming weeks as we get even more clarity regarding some of the unknowns cited above.
With that in mind, let’s turn our attention to EM rates. In the note Global Rate Curves (Ex-Asia) At an Inflection Point, I discussed the impact of elevated rates volatility in the US on the long ends of EM rate curves. Below, I highlight the impact on the short end of the EM rate curves – i.e., on the monetary policy path in emerging countries – from the Fed’s monetary tightening. Specifically:
- The volatility of EM 2y has increased with the US:
- Historically, the volatility of the short end of EM rate curves correlates well with the volatility of US rates. It is, therefore, not a surprise that the recent rise in the US rates’ volatility has spilled over to EM as the chart below shows. Nevertheless, the sharp increase in the volatility of EM 2y is notable since its close to the highest over the past decade. There are two main reasons for this:
- As the US raises rates, the interest-rate differential between emerging countries and the US narrows, which then weighs on their currencies. As such, there is pressure on these countries to follow the US and raise rates, even if they were ahead of the curve.
- Russia’s invasion of Ukraine has resulted in a sharp increase in food and energy prices, which typically make up a greater share of the CPI baskets in emerging countries. The risk of second-round effects from the rise in commodity prices then pressures central banks in these countries to be proactive.
- Historically, the volatility of the short end of EM rate curves correlates well with the volatility of US rates. It is, therefore, not a surprise that the recent rise in the US rates’ volatility has spilled over to EM as the chart below shows. Nevertheless, the sharp increase in the volatility of EM 2y is notable since its close to the highest over the past decade. There are two main reasons for this:
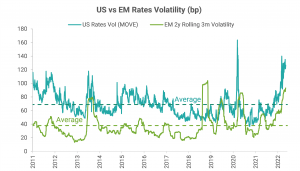
Data Source: Refinitiv; Note: EM = equally weighted index of rates in 18 countries
- EM 2y rates continue to rise:
- Even though many emerging countries started raising rates much earlier than the Fed, their short-end rates have yet to peak (see the chart below) for two reasons:
- Asian countries have in general been slow to tighten as inflationary pressures remained broadly contained in the region, allowing them to emphasize growth over inflation. With inflation now rising in Asia as well, the priority has shifted to anchoring inflation expectations, thus keeping short-end rates high in these countries. India and Malaysia caught the market by surprise with rate hikes at their last meetings as they joined other countries in the region which were already tightening – Korea, Taiwan, and Singapore. China is an exception as it’s going through a different dynamic of slowing growth aggravated by lockdowns due to its zero-Covid policy.
- Even though countries in Latin America and Central Europe started raising rates early, inflation has yet to peak in these countries which combined with the two risks cited above – the Fed raising rates and higher commodity prices – is resulting in expectations of more rate hikes.
- Even though many emerging countries started raising rates much earlier than the Fed, their short-end rates have yet to peak (see the chart below) for two reasons:
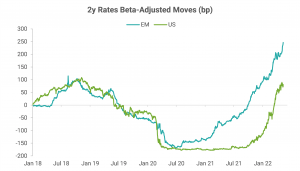
Data Source: Refinitiv; Note: EM = equally weighted index of rates in 18 countries
- The spread of EM to US 2y is close to its widest:
- As EM 2y started rising before the US 2y and continued to go up even when the US 2y started moving higher, the spread between the two is much higher than the historical average. The spread has come off the peak but remains close to its widest over the past decade as the first chart below shows.
- In addition to the reasons mentioned earlier, the high volatility of US rates is another factor keeping the spread wide, as the second chart below shows.
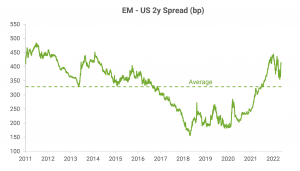
Data Source: Refinitiv; Note: EM = equally weighted index of rates in 18 countries
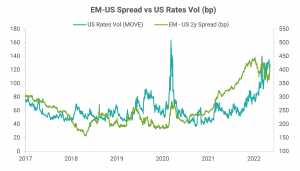
Data Source: Refinitiv; Note: EM = equally weighted index of rates in 18 countries
- What to expect going forward?
- All the reasons discussed above imply that EM 2y rates on aggregate should remain high in the near term. However, if the volatility of US rates starts coming off in the coming weeks as I expect, then EM 2y rates should on aggregate start falling, led by countries in Latin America and Central Europe even as they will remain elevated in Asia.
- The correlation between EM and US 2y yields is on the high side historically. However, as the chart below shows, the correlation between the two is not very strong. As such, I envision this correlation dropping and possibly even turning negative.
- From a trading perspective:
- I like receiving the short-end rates in Latin American countries.
- I like curve steepening trades in Latin American and Central European countries.
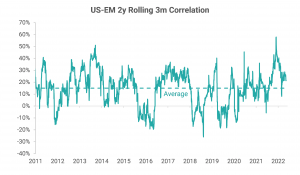
Data Source: Refinitiv; Note: EM = equally weighted index of rates in 18 countries
Model-Based Best Longs / Best Shorts
- To the list of underperformers based purely on my models in the attached Rates 10y Dashboard pdf, I added Czech 10y (CZK 10y) and Thailand 10y (THB 10y) as their z-scores crossed 1, both on an outright basis and based on the spread to the US.
- The list already had Hungary 10y (HUF 10y), Poland 10y (PLN 10y), and Peru 10y (PEN 10y) on it.
- The list of outperformers was unchanged as it stayed empty.
Model-Based Best Crosses
- The list of the preferred relative-value trades based on my models expanded to Receive PEN 10y vs Pay Chile 10y (CLP 10y) or China 10y (CNY 10y) or Japan 10y (JPY 10y) or UK 10y (GBP 10y) or Korea 10y (KRW 10y).
- The 3m expected returns for these pairs are in the range of 15-18% (not annualized), assuming mean reversion.

Gautam Jain
Estrategista - Ph.D, CFA
New York, EUA
Aviso legal
DISCLAIMER: Este Relatório de Análise foi elaborado e distribuído pelo Analista, signatário unicamente para uso do destinatário original, de acordo com todas as exigências previstas na Resolução CVM nº 20 de 26 de fevereiro de 2021 e tem como objetivo fornecer informações que possam auxiliar o investidor a tomar sua própria decisão de investimento, não constituindo qualquer tipo de oferta ou solicitação de compra e/ou venda de qualquer produto. As decisões de investimentos e estratégias financeiras devem ser realizadas pelo próprio leitor, os Analistas, ou a OHMRESEARCH não se responsabilizam por elas. Os produtos apresentados neste relatório podem não ser adequados para todos os tipos de investidores. Antes de qualquer decisão de investimentos, os investidores deverão realizar o processo de suitability no agente de distribuição de sua confiança e confirmar se os produtos apresentados são indicados para o seu perfil de investidor. A rentabilidade de produtos financeiros pode apresentar variações e seu preço ou valor pode aumentar ou diminuir num curto espaço de tempo. Os desempenhos anteriores não são necessariamente indicativos de resultados futuros. A rentabilidade divulgada não é líquida de impostos. As informações presentes neste material são baseadas em simulações e os resultados reais poderão ser significativamente diferentes.
O(s) signatário(s) deste relatório declara(m) que as recomendações refletem única e exclusivamente suas análises e opiniões pessoais, que foram produzidas de forma totalmente independente e que a OHMRESEARCH não tem qualquer gerência sobre este conteúdo. As opiniões aqui expressas estão sujeitas a modificações sem aviso prévio em decorrência de alterações nas condições de mercado. O Analista responsável pelo conteúdo deste relatório e pelo cumprimento da Resolução CVM nº 20/21 está indicado acima, sendo que, caso constem a indicação de mais um analista no relatório, o responsável será o primeiro analista credenciado a ser mencionado no relatório. Os analistas cadastrados na OHMRESEARCH estão obrigados ao cumprimento de todas as regras previstas no Código de Conduta da APIMEC para o Analista de Valores Mobiliários e no Manual de Controles Internos para Elaboração e Publicação de Relatórios da OHMRESEARCH. De acordo com o art. 21 da Resolução CVM nº 20/21 caso o Analista esteja em situação que possa afetar a imparcialidade do relatório ou que configure ou possa configurar conflito de interesse, este fato deverá estar explicitado no campo “Conflitos de Interesse” deste relatório.
O conteúdo deste relatório é de propriedade única do Analista signatário e não pode ser copiado, reproduzido ou distribuído, no todo ou em parte, a terceiros, sem prévia e expressa autorização deste Analista. Todas as informações utilizadas neste documento foram redigidas com base em informações públicas, de fontes consideradas fidedignas. Embora tenham sido tomadas todas as medidas razoáveis para assegurar que as informações aqui contidas não são incertas ou equívocas no momento de sua publicação, o Analista não responde pela veracidade das informações do conteúdo.
Para maiores informações, pode-se ler a Resolução CVM nº 20/21 e o Código de Conduta da APIMEC para o Analista de Valores Mobiliários. Este relatório é destinado exclusivamente ao assinante da OHMRESEARCH que o contratou. A sua reprodução ou distribuição não autorizada, sob qualquer forma, no todo ou em parte, implicará em sanções cíveis e criminais cabíveis, incluindo a obrigação de reparação de todas as perdas e danos causados, nos termos da Lei nº 9.610/98 e de outras aplicáveis.