Resumo do Relatório
Rates Dashboard: Are Mexico’s Local Bonds Cheap?
 (1 votes, average: 5,00 out of 5)
You need to be a registered member to rate this.
US yields continue to rise, with the 10-year nominal rate at its highest level since 2018 as it approaches 3% and the 10-year real rate turning positive for the first time in more than two years. Not surprisingly, local bonds in emerging countries have also taken a hit. However, unlike in 2021 when EM rates sold off by a multiple of the correction in US rates, this year the situation has reversed: While the US 10y yield has gone up 135 bp this year, EM 10y ex-Russia rate has risen only 95 bp.
The main reason behind the outperformance of EM rates relative to the US is:
- With emerging countries in Latin America and CEEMEA ahead of the US in terms of monetary tightening, their rate curves had already adjusted higher. Indeed, as I pointed out in EM Rates Detach from the US Amid Russian Contagion, the spread of EM rates to the US was already at its widest in a decade. I was cautious about EM rates at that time, but they have surprised positively by outperforming.
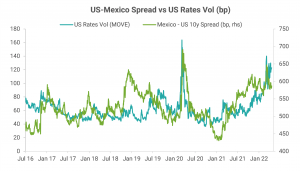
Mexico is an interesting case study. Mexican local bonds have behaved slightly worse than the broad EM universe but better than the US: MXN 10y has sold off 115 bp on a year-to-date basis. As the chart below shows, the spread of Mexico 10y to the US is close to its widest in a decade. The same chart shows that the correlation between the spread of Mexico to the US and the US 10y yield goes through cycles:
- They were inversely correlated between 2011 and 2017 and from 2020 to mid-2021.
- They were positively correlated between 2018 and 2019.
- Since mid-2021, the correlation between the two has broken off as the spread has remained relatively stable, albeit at a high level, even as US yields continue to rise.

Data Source: Refinitiv
A better explanation for the movements in the spread of Mexico to the US can be obtained from the chart below. The chart shows that rather than the level of US rates, it’s their volatility that drives the spread: higher volatility of US rates typically means a wider spread and vice versa.
This is intuitive as a rise in rates volatility signifies an uncertain and risk-averse environment when the appetite for Mexican or other EM assets should be low. If anything, the chart shows that in recent days, the spread has not risen as much as the rise in the volatility of rates should have implied.
Data Source: Refinitiv
Although Mexico’s spread to the US has stabilized, the natural question to ask is: What would make the spread of Mexico to the US narrow? In other words, can Mexico 10y outperform even as US yields continue to rise?
To address this question, I go over the drivers behind Mexican rates. As detailed below, it is not a straightforward conclusion as there are arguments on both sides (The signs in parentheses show whether a factor helps or hurts Mexican rates):
- Inflation and monetary policy:
- (-) Accelerating inflation: The headline inflation in March reached a 21-year high of 7.45% YoY, significantly outside the 2-4% target range of Banco de México (Banxico). The core inflation was not much lower at 6.78% YoY.
- (+) Inflation to peak soon: In the March MPC statement, Banxico forecasts that the CPI should peak in Q1 at 7.2%. Given the continued spike in food and energy prices since then, the peak is more likely to occur in Q2 instead of Q1, in my view. Nevertheless, inflation should peak in the coming months.
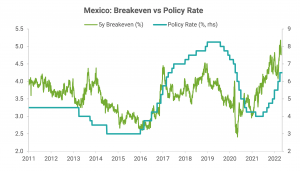
- (-) Rising breakeven inflation and inflation expectations: Concerningly, inflation breakevens have risen to the highest in a decade, not just for short tenors but even further out in the curve (see the chart below). Moreover, in Banxico’s monthly survey, inflation forecasts for 2022 and 2023 rose further to 5.86% and 3.98%, respectively. The latter is at the upper end of Banxico’s inflation target range.
- (-) Fed to increase the pace of rate hikes: A more aggressive Fed puts pressure on Banxico to follow suit.
- (+) Aggressive monetary tightening priced: In line with high inflation expectations and breakevens, the curve is pricing in another 300 bp of rate hikes over the next year, following the 250 bp of rate increases already delivered since mid-2021. The minutes of the last meeting showed that one board member proposed front-loading the tightening, indicating that there is a possibility of an increase in the pace of tightening. While Banxico started raising rates more slowly than its other Latin American peers, the curve is now pricing in a catch-up.
Data Source: Refinitiv
- (+) Real rates among the highest globally: Mexico is among the countries with the highest 2-year real rate (see the chart below), implying that it is ahead of other countries in terms of rate normalization from the pandemic lows. Moreover, at 2.8%, the real rate is much higher than Mexico’s 20-year average real rate of 1.8%. Mexican rates are, therefore, more likely to outperform than underperform other countries, even if rates globally continue to adjust higher.

Data Source: Refinitiv, Bloomberg; Note: EM = equally weighted index of rates in 18 countries; real rate computed using Bloomberg’s consensus 1y inflation forecasts
- (+) Weak growth: The IMF cut its growth forecast for Mexico to 2% from 2.8% this month, driven by the drop in the growth forecast of its main trade partner, the US. This is lower than the expectation of Banxico (2.4%) and the Mexican government (3.4%). Given these growth expectations combined with the likelihood of an upcoming inflation peak, Banxico may deliver fewer rate hikes than priced.
- (+) Foreign holdings already low: The increase in foreign holdings of Mexican local debt at the start of the year proved temporary as it promptly dropped this month to 40%, the lowest in a decade as the chart below shows. The pressure from selling by foreign holders is, therefore, limited.
- Fiscal balance:
- (+) Fiscal discipline during Covid – even though it came at a cost of lower growth – means that Mexico is one of the few countries that has not seen a deterioration of its debt profile.
- (+) High oil prices have led President AMLO to reverse his intention to curtail oil exports, which should help the budget.
- (-) Continued support for Pemex: The need to provide financial support to Pemex weighs on the country’s fiscal strength as Moody’s stated recently.
- Political developments:
- (+) AMLO’s power reform bill fails: The attempt by President AMLO to change the constitution to restore state control of the electricity sector failed. More importantly, it pushed back against AMLO’s nationalist agenda, which is a market positive.
- (-) Airport cancelation still weighs on Mexican assets: In 2018, AMLO canceled an unfinished airport in Mexico City following a referendum, arguing that it was linked to corruption. Even though Mexico paid off the bondholders who invested in the project, the unilateral and radical step continues to discourage private investments, particularly by foreigners. As such, this should continue to be reflected as a risk premium in the bond curve.
While there are arguments on both sides, given the current wide spread of Mexico to the US, high real rates, and inflation likely to peak soon, I am in favor of receiving rates in Mexico and accordingly, have an outstanding trade recommendation.
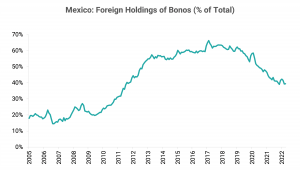
Data Source: Banco de México
Best Longs / Best Shorts
- The list of underperformers based purely on my models in the attached Rates 10y Dashboard pdf stayed unchanged with Hungary 10y (HUF 10y) and Poland 10y (PLN 10y) on it.
- The list of outperformers was also unchanged as it stayed empty.
Best Crosses
- The list of the preferred relative-value trades based on my models changed to Receive Peru 10y (PEN 10y) vs Pay China 10y (CNY 10y) or Japan 10y (JPY 10y) or Chile 10y (CLP 10y).
- The 3m expected returns for these pairs are in the range of 11-12% (not annualized), assuming mean reversion.

Gautam Jain
Estrategista - Ph.D, CFA
New York, EUA
Aviso legal
DISCLAIMER: Este Relatório de Análise foi elaborado e distribuído pelo Analista, signatário unicamente para uso do destinatário original, de acordo com todas as exigências previstas na Resolução CVM nº 20 de 26 de fevereiro de 2021 e tem como objetivo fornecer informações que possam auxiliar o investidor a tomar sua própria decisão de investimento, não constituindo qualquer tipo de oferta ou solicitação de compra e/ou venda de qualquer produto. As decisões de investimentos e estratégias financeiras devem ser realizadas pelo próprio leitor, os Analistas, ou a OHMRESEARCH não se responsabilizam por elas. Os produtos apresentados neste relatório podem não ser adequados para todos os tipos de investidores. Antes de qualquer decisão de investimentos, os investidores deverão realizar o processo de suitability no agente de distribuição de sua confiança e confirmar se os produtos apresentados são indicados para o seu perfil de investidor. A rentabilidade de produtos financeiros pode apresentar variações e seu preço ou valor pode aumentar ou diminuir num curto espaço de tempo. Os desempenhos anteriores não são necessariamente indicativos de resultados futuros. A rentabilidade divulgada não é líquida de impostos. As informações presentes neste material são baseadas em simulações e os resultados reais poderão ser significativamente diferentes.
O(s) signatário(s) deste relatório declara(m) que as recomendações refletem única e exclusivamente suas análises e opiniões pessoais, que foram produzidas de forma totalmente independente e que a OHMRESEARCH não tem qualquer gerência sobre este conteúdo. As opiniões aqui expressas estão sujeitas a modificações sem aviso prévio em decorrência de alterações nas condições de mercado. O Analista responsável pelo conteúdo deste relatório e pelo cumprimento da Resolução CVM nº 20/21 está indicado acima, sendo que, caso constem a indicação de mais um analista no relatório, o responsável será o primeiro analista credenciado a ser mencionado no relatório. Os analistas cadastrados na OHMRESEARCH estão obrigados ao cumprimento de todas as regras previstas no Código de Conduta da APIMEC para o Analista de Valores Mobiliários e no Manual de Controles Internos para Elaboração e Publicação de Relatórios da OHMRESEARCH. De acordo com o art. 21 da Resolução CVM nº 20/21 caso o Analista esteja em situação que possa afetar a imparcialidade do relatório ou que configure ou possa configurar conflito de interesse, este fato deverá estar explicitado no campo “Conflitos de Interesse” deste relatório.
O conteúdo deste relatório é de propriedade única do Analista signatário e não pode ser copiado, reproduzido ou distribuído, no todo ou em parte, a terceiros, sem prévia e expressa autorização deste Analista. Todas as informações utilizadas neste documento foram redigidas com base em informações públicas, de fontes consideradas fidedignas. Embora tenham sido tomadas todas as medidas razoáveis para assegurar que as informações aqui contidas não são incertas ou equívocas no momento de sua publicação, o Analista não responde pela veracidade das informações do conteúdo.
Para maiores informações, pode-se ler a Resolução CVM nº 20/21 e o Código de Conduta da APIMEC para o Analista de Valores Mobiliários. Este relatório é destinado exclusivamente ao assinante da OHMRESEARCH que o contratou. A sua reprodução ou distribuição não autorizada, sob qualquer forma, no todo ou em parte, implicará em sanções cíveis e criminais cabíveis, incluindo a obrigação de reparação de todas as perdas e danos causados, nos termos da Lei nº 9.610/98 e de outras aplicáveis.