Resumo do Relatório
FX Dashboard: How Have the Sensitivities of EM FX to US Dollar Evolved?
 (1 votes, average: 5,00 out of 5)
You need to be a registered member to rate this.
With the US dollar (DXY) appreciating again on rising risk aversion, recall that our view is the dollar strengthening episode should be brief, as we laid out in Time to Hedge EM FX with Euro Again. Nevertheless, it is important to see which EM currencies are more vulnerable and which are less if the dollar continues to appreciate.
To do so, we focus on the systematic risk or beta of each EM currency to the dollar and how they have evolved. Since the beta of some EM currencies to the dollar is not very stable, we find it more useful to compute the beta in a two-step process: First, find the beta of each EM currency with a broad index of EM currencies, and then compute the beta of this index with the US dollar as the latter is more stable.
The chart below compares the 2-year beta of each EM currency with its 1-year beta to highlight how they have changed.
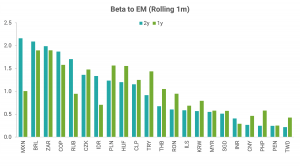
Data Source: Refinitiv
We can make a few observations from the chart:
- In general, the betas have increased for Central European and Asian currencies with the exceptions of the Indonesian rupiah (IDR) and the Indian rupee (INR). In other words, these currencies are more exposed to dollar moves than in the past.
- Besides IDR and INR, the beta has dropped considerably for Mexican peso (MXN) and Russian ruble (RUB), while it has risen for Turkish lira (TRY).
- For the rest of the currencies, the betas have been relatively stable.
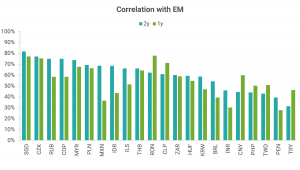
To better understand the drivers of these changes, in the charts below, we look at correlation and volatility changes as the beta depends on these.
- In the case of MXN, IDR, and RUB, both their correlations with EM as well as their volatilities have dropped explaining the drop in their betas. These currencies are thus less sensitive than in the past to dollar moves.
- In the case of TRY, the reverse transpired as both the correlation and volatility increased, leading to higher beta and therefore greater systematic risk for the currency.
- For the Central European and Asian currencies ex-IDR and INR, the increase in beta has been driven primarily by the increase in their correlations with the rest of EM as their volatilities are lower now than before, except for the Chinese renminbi (CNY).
To conclude, our trade recommendations in the coming weeks will be informed by the following:
- If the dollar continues to appreciate, the volatilities of EM currencies should start rising as well. Given the already high correlations, in general, betas should rise.
- However, the ones that are more exposed to the dollar than previously are Central European currencies, Asian currencies ex-IDR and INR, and TRY.
- The currencies that are less vulnerable than before to dollar moves based on the systematic risk alone are MXN, RUB, IDR, and INR.
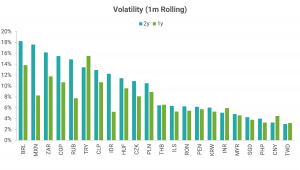
Data Source: Refinitiv
Best Longs / Best Shorts
- The list of underperformers based on our models in the attached FX Dashboard stayed unchanged with Peruvian sol (PEN), Chilean peso (CLP), Korean won (KRW), Thai baht (THB), and Philippine peso (PHP) on it.
- The list of outperformers stayed empty.
Best Crosses
- The list of the preferred relative-value trades based on our models changed to Long CLP vs Short RUB or Colombian peso (COP) or Israeli shekel (ILS) or IDR.
- The 3m expected returns for these pairs are in the range of 9-10% (not annualized), assuming mean reversion.

Gautam Jain
Estrategista - Ph.D, CFA
New York, EUA
Aviso legal
DISCLAIMER: Este Relatório de Análise foi elaborado e distribuído pelo Analista, signatário unicamente para uso do destinatário original, de acordo com todas as exigências previstas na Resolução CVM nº 20 de 26 de fevereiro de 2021 e tem como objetivo fornecer informações que possam auxiliar o investidor a tomar sua própria decisão de investimento, não constituindo qualquer tipo de oferta ou solicitação de compra e/ou venda de qualquer produto. As decisões de investimentos e estratégias financeiras devem ser realizadas pelo próprio leitor, os Analistas, ou a OHMRESEARCH não se responsabilizam por elas. Os produtos apresentados neste relatório podem não ser adequados para todos os tipos de investidores. Antes de qualquer decisão de investimentos, os investidores deverão realizar o processo de suitability no agente de distribuição de sua confiança e confirmar se os produtos apresentados são indicados para o seu perfil de investidor. A rentabilidade de produtos financeiros pode apresentar variações e seu preço ou valor pode aumentar ou diminuir num curto espaço de tempo. Os desempenhos anteriores não são necessariamente indicativos de resultados futuros. A rentabilidade divulgada não é líquida de impostos. As informações presentes neste material são baseadas em simulações e os resultados reais poderão ser significativamente diferentes.
O(s) signatário(s) deste relatório declara(m) que as recomendações refletem única e exclusivamente suas análises e opiniões pessoais, que foram produzidas de forma totalmente independente e que a OHMRESEARCH não tem qualquer gerência sobre este conteúdo. As opiniões aqui expressas estão sujeitas a modificações sem aviso prévio em decorrência de alterações nas condições de mercado. O Analista responsável pelo conteúdo deste relatório e pelo cumprimento da Resolução CVM nº 20/21 está indicado acima, sendo que, caso constem a indicação de mais um analista no relatório, o responsável será o primeiro analista credenciado a ser mencionado no relatório. Os analistas cadastrados na OHMRESEARCH estão obrigados ao cumprimento de todas as regras previstas no Código de Conduta da APIMEC para o Analista de Valores Mobiliários e no Manual de Controles Internos para Elaboração e Publicação de Relatórios da OHMRESEARCH. De acordo com o art. 21 da Resolução CVM nº 20/21 caso o Analista esteja em situação que possa afetar a imparcialidade do relatório ou que configure ou possa configurar conflito de interesse, este fato deverá estar explicitado no campo “Conflitos de Interesse” deste relatório.
O conteúdo deste relatório é de propriedade única do Analista signatário e não pode ser copiado, reproduzido ou distribuído, no todo ou em parte, a terceiros, sem prévia e expressa autorização deste Analista. Todas as informações utilizadas neste documento foram redigidas com base em informações públicas, de fontes consideradas fidedignas. Embora tenham sido tomadas todas as medidas razoáveis para assegurar que as informações aqui contidas não são incertas ou equívocas no momento de sua publicação, o Analista não responde pela veracidade das informações do conteúdo.
Para maiores informações, pode-se ler a Resolução CVM nº 20/21 e o Código de Conduta da APIMEC para o Analista de Valores Mobiliários. Este relatório é destinado exclusivamente ao assinante da OHMRESEARCH que o contratou. A sua reprodução ou distribuição não autorizada, sob qualquer forma, no todo ou em parte, implicará em sanções cíveis e criminais cabíveis, incluindo a obrigação de reparação de todas as perdas e danos causados, nos termos da Lei nº 9.610/98 e de outras aplicáveis.