Resumo do Relatório
Rates Dashboard: South African Bonds Switch from Outperformers to Underperformers
 (1 votes, average: 5,00 out of 5)
You need to be a registered member to rate this.
The upside surprise in the US CPI data last week continues to reverberate with the market reassessing the monetary policy path and is now pricing the Fed Funds rate to reach 4% in a year. As a result, the volatility in the global rates market picked up from its already high levels over the past few days, with US rates touching decade highs across the curve.
While South African local bonds had weathered the volatility in 2021 well, this time around, they have gone from outperforming against the rest of EM to underperforming. It is not just the external environment though. Domestic developments have shifted to the negative side for rates in South Africa. Specifically:
- Rising inflation expectations:
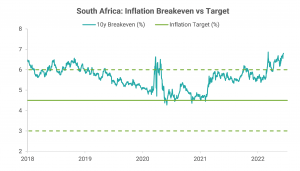
- Inflation breakevens continue to increase with the 10y breakeven reaching a 5-year high and staying above the upper end of South Africa Reserve Bank’s (SARB’s) 3-6% inflation target band since April (see the first chart below). Indeed, the breakeven curve is above the upper end of the target band for tenors from 5 years onwards (see the second chart below).
- Although April CPI came in line with expectations and was just inside the target band at 5.9% YoY, PPI came in above expectations and was the highest since 2013 at 13.1% YoY.
- Fuel subsidies, which were set to expire, were extended by two months. Not doing so would have added to inflationary pressures along with hurting consumers. The Treasury is debating whether to sell oil reserves or take a hit to the budget in funding the extension of the subsidies. Effectively, the price increase has been postponed by two months.
- Wage negotiations are ongoing with the most notable one between Eskom and the National Union of Metalworkers of South Africa (Numsa), with the latter lowering its demand to 12% while Eskom is offering annual increases of 5.3%, 4.5%, and 4%.
Data Source: Refinitiv

Data Source: Refinitiv
- Monetary tightening picks up pace: South Africa Reserve Bank (SARB) raised the pace with a 50 bp increase in May from 25 bp in the previous three meetings. In doing so, the SARB raised the inflation forecast, indicating that further rate increases of similar magnitudes should be expected especially in the context of the upcoming tightening by the Fed and the ECB. The rate curve is pricing in over 250 bp of rate hikes in 1 year. Real rates are only marginally positive as the chart below shows.

Data Source: Refinitiv, Bloomberg; Note: EM = equally weighted index of rates in 18 countries; real rate computed using Bloomberg’s consensus 1y inflation forecasts
- Structurally weak growth weighs on fiscal outlook: Although Q1 GDP growth beat forecasts, floods in the KwaZulu-Natal province are expected to weigh on Q2 growth. Indeed, manufacturing production fell by 7.8% in April. Bloomberg consensus expects growth to drop to 1.9% in 2022 from 5.5% last year. Overall, as I discussed in South African Rand’s Outperformance Is Overdone, structural problems – low productivity, high unemployment, graft, and electricity shortage – continue to weigh on the country’s potential growth.
- Concerning debt profile: Demand for South African debt has waned with outflows accelerating sharply in 2022 – see the chart below. Recent bond auctions have also seen weak demand. A combination of higher rates due to rising inflation and the resulting monetary tightening as well as weaker growth and fiscal outlook is weighing on the bond market. Even the Treasury expects the debt to peak at 75% of GDP.

Data Source: Bloomberg
As such, it is not a surprise to see rates in South Africa turn around. Indeed, while the volatility of rates in South Africa remained low relative to the rest of the emerging markets in 2021, this year it is catching up – see the chart below.

Data Source: Refinitiv; Note: EM = equally weighted index of rates in 18 countries
Given that they have outperformed the rest of EM significantly over the past year, in theory, there is a lot of room for further underperformance for South Africa’s local bonds. Nevertheless, the long-term weak growth outlook should prevent inflation expectations from rising much further from current levels. As a result, I expect rates in South Africa to continue to lag but I expect the spread differential with EM to stay below its long-term average (see the chart below). Other emerging countries, particularly in Asia (see my note from last month), are much more vulnerable to rising global rates, particularly in developed countries.

Data Source: Refinitiv; Note: EM = equally weighted index of rates in 18 countries
Model-Based Best Longs / Best Shorts
- From the list of underperformers based purely on my models in the attached Rates 10y Dashboard pdf, I removed Peru 10y (PEN 10y) as its z-score receded.
- The list now has Hungary 10y (HUF 10y), Poland 10y (PLN 10y), and Czech 10y (CZK 10y) on it.
- The list of outperformers was unchanged as it stayed empty.
Model-Based Best Crosses
- The list of the preferred relative-value trades based on my models changed to Receive PLN 10y vs Pay Brazil 10y (BRL 10y) or China 10y (CNY 10y) or Japan 10y (JPY 10y) and Receive HUF 10y vs Pay BRL 10y.
- The 3m expected returns for these pairs are in the range of 12-15% (not annualized), assuming mean reversion.

Gautam Jain
Estrategista - Ph.D, CFA
New York, EUA
Aviso legal
DISCLAIMER: Este Relatório de Análise foi elaborado e distribuído pelo Analista, signatário unicamente para uso do destinatário original, de acordo com todas as exigências previstas na Resolução CVM nº 20 de 26 de fevereiro de 2021 e tem como objetivo fornecer informações que possam auxiliar o investidor a tomar sua própria decisão de investimento, não constituindo qualquer tipo de oferta ou solicitação de compra e/ou venda de qualquer produto. As decisões de investimentos e estratégias financeiras devem ser realizadas pelo próprio leitor, os Analistas, ou a OHMRESEARCH não se responsabilizam por elas. Os produtos apresentados neste relatório podem não ser adequados para todos os tipos de investidores. Antes de qualquer decisão de investimentos, os investidores deverão realizar o processo de suitability no agente de distribuição de sua confiança e confirmar se os produtos apresentados são indicados para o seu perfil de investidor. A rentabilidade de produtos financeiros pode apresentar variações e seu preço ou valor pode aumentar ou diminuir num curto espaço de tempo. Os desempenhos anteriores não são necessariamente indicativos de resultados futuros. A rentabilidade divulgada não é líquida de impostos. As informações presentes neste material são baseadas em simulações e os resultados reais poderão ser significativamente diferentes.
O(s) signatário(s) deste relatório declara(m) que as recomendações refletem única e exclusivamente suas análises e opiniões pessoais, que foram produzidas de forma totalmente independente e que a OHMRESEARCH não tem qualquer gerência sobre este conteúdo. As opiniões aqui expressas estão sujeitas a modificações sem aviso prévio em decorrência de alterações nas condições de mercado. O Analista responsável pelo conteúdo deste relatório e pelo cumprimento da Resolução CVM nº 20/21 está indicado acima, sendo que, caso constem a indicação de mais um analista no relatório, o responsável será o primeiro analista credenciado a ser mencionado no relatório. Os analistas cadastrados na OHMRESEARCH estão obrigados ao cumprimento de todas as regras previstas no Código de Conduta da APIMEC para o Analista de Valores Mobiliários e no Manual de Controles Internos para Elaboração e Publicação de Relatórios da OHMRESEARCH. De acordo com o art. 21 da Resolução CVM nº 20/21 caso o Analista esteja em situação que possa afetar a imparcialidade do relatório ou que configure ou possa configurar conflito de interesse, este fato deverá estar explicitado no campo “Conflitos de Interesse” deste relatório.
O conteúdo deste relatório é de propriedade única do Analista signatário e não pode ser copiado, reproduzido ou distribuído, no todo ou em parte, a terceiros, sem prévia e expressa autorização deste Analista. Todas as informações utilizadas neste documento foram redigidas com base em informações públicas, de fontes consideradas fidedignas. Embora tenham sido tomadas todas as medidas razoáveis para assegurar que as informações aqui contidas não são incertas ou equívocas no momento de sua publicação, o Analista não responde pela veracidade das informações do conteúdo.
Para maiores informações, pode-se ler a Resolução CVM nº 20/21 e o Código de Conduta da APIMEC para o Analista de Valores Mobiliários. Este relatório é destinado exclusivamente ao assinante da OHMRESEARCH que o contratou. A sua reprodução ou distribuição não autorizada, sob qualquer forma, no todo ou em parte, implicará em sanções cíveis e criminais cabíveis, incluindo a obrigação de reparação de todas as perdas e danos causados, nos termos da Lei nº 9.610/98 e de outras aplicáveis.