Resumo do Relatório
Rates 10y Dashboard: South Africa’s Rate Curve Set to Steepen
 (1 votes, average: 5,00 out of 5)
You need to be a registered member to rate this.
As was widely expected, the South Africa Reserve Bank (SARB) left rates on hold at its MPC meeting today in a unanimous decision. Overall, the tone was dovish as the SARB emphasized its concerns about the economic recovery on the back of recent events. The immediate reaction was for the 2y rate to rally 10 bp while the long end remained steady, resulting in the curve steepening.
In the near term, we expect the curve to steepen further on the back of several drivers:
- Growth: The GDP is expected to contract in Q3 due to:
- Riots: Following the imprisonment of former President Jacob Zuma, the country suffered its worst riots since the end of the apartheid in 1994, leaving more than 200 people dead. Businesses were damaged and key transportation routes were disrupted in the economic hubs of Gauteng and KwaZulu-Natal provinces where Zuma’s support is strong.
- Coronavirus: The vaccination rate in South Africa was already one of the lowest among major countries. The riots have slowed down the process even further. Less than 10% of adults have received one shot of the vaccine so far while the country is seeing a spike in cases and deaths as it is going through the third coronavirus wave.
- Fiscal slippage: The riots have brought to light the country’s endemic poverty and extreme inequality, both of which have been worsened by coronavirus lockdowns. The government is discussing plans with business and labor leaders to disburse either a temporary relief grant or a form of basic income. The upcoming local elections in October would likely add to the political pressure to do so. The fiscal deficit, which was already high, is likely to worsen and pressure the long end of the rates curve.
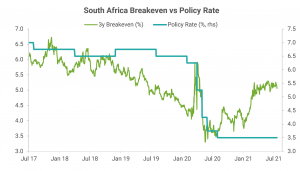
- Inflation: While inflation has been rising in South Africa, it is well within the target band, unlike many other emerging countries. Moreover, the headline CPI declined to 4.9% YoY in June from 5.2% in May. Five-year breakeven inflation has stopped rising and has stabilized around 5% (see the first chart below).
- Monetary policy: We expect SARB to stay on hold at least through the end of the year as growth uncertainty is high and inflation is not a concern currently. Slowing growth and inflation are likely to push rate hike expectations further out and bring short-end rates lower.
- Flows: Foreign investors have net sold ZAR 45 bn of local bonds this year based on JSE data, according to Bloomberg. Foreign holdings tend to be in long-duration bonds, implying that flows are adding to the pressure on the long end of the curve, which has done well this year and has outperformed against EM as the second chart below shows.
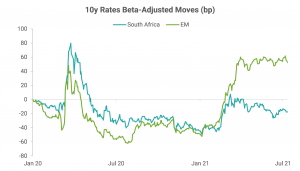
Data Source: Refinitiv; Note: EM = equally weighted index of rates in 19 countries
If the curve steepens as we expect, then it will make it even more extreme on a historical basis and compared with the rest of EM (see the chart below). As such, instead of position for steepening now, we would wait for the curve to steepen to enter a flattener.
We had recommended a 2s10s flattener in South Africa in March when global long-end rates were selling off in sympathy with the US. With rate hike expectations rising and the high long-end yield attracting inflows, in early June, we recommended taking profits on the trade as the curve flattened. An opportunity to reenter a flattener may arise again in the near term.
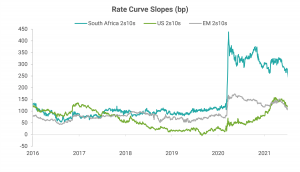
Data Source: Refinitiv; Note: EM = equally weighted index of rates in 19 countries
Best Longs / Best Shorts
- The lists of underperformers and outperformers based on our models in the attached Rates 10y Dashboard pdf stayed unchanged.
- The list of underperformers consists of Chile 10y (CLP 10y), Peru 10y (PEN 10y), and Colombia 10y (COP 10y), while the list of outperformers stayed empty.
Best Crosses
- The list of preferred relative-value trades based on our models changed to Receive PEN 10y or CLP 10y vs Pay Thailand 10y (THB 10y) or China 10y (CNY 10y).
- The 3m expected returns for these pairs are in the range of 7.5-8.0% (not annualized), assuming mean reversion.

Gautam Jain
Estrategista - Ph.D, CFA
New York, EUA
Aviso legal
DISCLAIMER: Este Relatório de Análise foi elaborado e distribuído pelo Analista, signatário unicamente para uso do destinatário original, de acordo com todas as exigências previstas na Resolução CVM nº 20 de 26 de fevereiro de 2021 e tem como objetivo fornecer informações que possam auxiliar o investidor a tomar sua própria decisão de investimento, não constituindo qualquer tipo de oferta ou solicitação de compra e/ou venda de qualquer produto. As decisões de investimentos e estratégias financeiras devem ser realizadas pelo próprio leitor, os Analistas, ou a OHMRESEARCH não se responsabilizam por elas. Os produtos apresentados neste relatório podem não ser adequados para todos os tipos de investidores. Antes de qualquer decisão de investimentos, os investidores deverão realizar o processo de suitability no agente de distribuição de sua confiança e confirmar se os produtos apresentados são indicados para o seu perfil de investidor. A rentabilidade de produtos financeiros pode apresentar variações e seu preço ou valor pode aumentar ou diminuir num curto espaço de tempo. Os desempenhos anteriores não são necessariamente indicativos de resultados futuros. A rentabilidade divulgada não é líquida de impostos. As informações presentes neste material são baseadas em simulações e os resultados reais poderão ser significativamente diferentes.
O(s) signatário(s) deste relatório declara(m) que as recomendações refletem única e exclusivamente suas análises e opiniões pessoais, que foram produzidas de forma totalmente independente e que a OHMRESEARCH não tem qualquer gerência sobre este conteúdo. As opiniões aqui expressas estão sujeitas a modificações sem aviso prévio em decorrência de alterações nas condições de mercado. O Analista responsável pelo conteúdo deste relatório e pelo cumprimento da Resolução CVM nº 20/21 está indicado acima, sendo que, caso constem a indicação de mais um analista no relatório, o responsável será o primeiro analista credenciado a ser mencionado no relatório. Os analistas cadastrados na OHMRESEARCH estão obrigados ao cumprimento de todas as regras previstas no Código de Conduta da APIMEC para o Analista de Valores Mobiliários e no Manual de Controles Internos para Elaboração e Publicação de Relatórios da OHMRESEARCH. De acordo com o art. 21 da Resolução CVM nº 20/21 caso o Analista esteja em situação que possa afetar a imparcialidade do relatório ou que configure ou possa configurar conflito de interesse, este fato deverá estar explicitado no campo “Conflitos de Interesse” deste relatório.
O conteúdo deste relatório é de propriedade única do Analista signatário e não pode ser copiado, reproduzido ou distribuído, no todo ou em parte, a terceiros, sem prévia e expressa autorização deste Analista. Todas as informações utilizadas neste documento foram redigidas com base em informações públicas, de fontes consideradas fidedignas. Embora tenham sido tomadas todas as medidas razoáveis para assegurar que as informações aqui contidas não são incertas ou equívocas no momento de sua publicação, o Analista não responde pela veracidade das informações do conteúdo.
Para maiores informações, pode-se ler a Resolução CVM nº 20/21 e o Código de Conduta da APIMEC para o Analista de Valores Mobiliários. Este relatório é destinado exclusivamente ao assinante da OHMRESEARCH que o contratou. A sua reprodução ou distribuição não autorizada, sob qualquer forma, no todo ou em parte, implicará em sanções cíveis e criminais cabíveis, incluindo a obrigação de reparação de todas as perdas e danos causados, nos termos da Lei nº 9.610/98 e de outras aplicáveis.