Resumo do Relatório
FX Dashboard: Is the Environment Supportive of EM FX Relative-Value Trades?
 (1 votes, average: 5,00 out of 5)
You need to be a registered member to rate this.
In the note Revisiting the US Dollar View and Its Implications for EM Currencies a couple of weeks ago, I outlined the reasoning behind my view that the dollar is likely to remain strong in the near term. Indeed, the dollar continues to hover around its strongest level in two decades, most recently driven by risk aversion arising from concerns about a global growth slowdown.
In line with my dollar view, the two trading themes that I have suggested for EM currencies are:
- Beta-neutral relative-value trades: EM currencies have weakened but with a fair degree of dispersion in their performances as the dollar has strengthened. While the overall environment may not support long positions in EM currencies, my view was that it could be conducive for relative-value trades to capitalize on differences across countries based on macroeconomic, political, and geopolitical developments.
- Hedge a diversified portfolio of EM currencies with the euro: I recommended maintaining a euro (EUR) hedge for a diversified portfolio of EM currencies because the euro should react similarly or possibly worse than EM currencies if the recession risk plays out.
Last week, I elaborated on the latter of the two strategies discussed above in How Well Is Hedging EM Currencies with the Euro Working?. In this note, I discuss the former. Specifically, I address whether relative-value trades still make sense:
- Volatility of EM currencies has increased sharply
- As the dollar has strengthened, its volatility has risen. Baring the brief spike at the start of the pandemic in March 2020, the volatility of the dollar is the highest since 2017 as the chart below shows.
- The volatility of a broad index of EM currencies has historically been lower than that of the dollar because of the diversification within the index due to the cross-correlations between currencies being less than 1. Currently, though, the volatility of such an index has risen sharply and is close to that of the dollar.
- Higher volatility in itself is not a problem. Indeed, the best environments for relative-value trades are typically those marked by high volatility as they are usually accompanied by wide dispersion between the performances of different currencies. Greater dispersion allows for trading opportunities when these deviations are more than warranted by fundamentals.
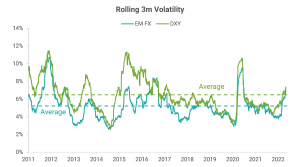
Data Source: Refinitiv; Note: EM FX = equally weighted index of spot returns of 21 currencies excluding the Russian ruble
- Decade high (negative) correlation of EM currencies with the dollar
- The (negative) correlation of a broad index of EM currencies to the dollar is at its highest since 2012 as the chart below shows. This is not conducive for relative-value trading as it implies that EM currencies are broadly tracking the dollar and weakening as it strengthens. If elevated volatility is accompanied by a high correlation across assets, then it is typically a sign of a risk-off environment, which is not ideal for trading based on fundamentals. Instead, in such an environment, assets sell off more or less in line with their long-term betas.

Data Source: Refinitiv; Note: EM FX = equally weighted index of spot returns of 21 currencies excluding the Russian ruble
- Dispersion is narrowing
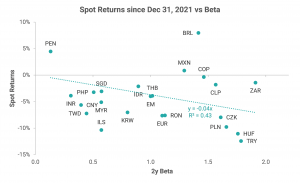
- A plot showing the year-to-date spot returns for EM currencies against their respective betas displays significant differentiation across countries, as the first chart below shows.
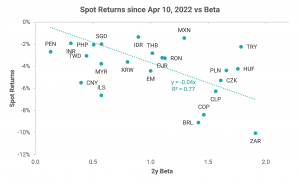
- However, as the second chart below shows, narrowing the time window to the past month leads to a much higher correlation across currencies: 88% over the past month versus 66% year to date. In other words, the cross-correlations are rising, which corroborates that it is a broad risk-off environment which not supportive of relative-value trading.
- We can see the same when plotting volatility versus dispersion. Dispersion can be measured in different ways. Volatility itself is a measure of dispersion. Other measures include the range and the difference between the first and the third quartiles. Since our goal is to identify whether differentiation across countries is increasing or not, a better measure is to look at the median of the absolute difference between each currency’s performance from the index. As the third chart below shows, the dispersion across EM currencies initially increased with volatility but is now falling even as the volatility continues to rise.
Data Source: Refinitiv; Note: EM FX = equally weighted index of spot returns of 21 currencies excluding the Russian ruble
Data Source: Refinitiv; Note: EM FX = equally weighted index of spot returns of 21 currencies excluding the Russian ruble

Data Source: Refinitiv; Note: EM FX = equally weighted index of spot returns of 21 currencies excluding the Russian ruble
- What does this imply for trading strategies?
- As discussed above, the market has likely entered a risk-off phase. As such, it may not be the best time to initiate relative-value trades. On the other hand, the environment has become even more supportive of the other strategy that I have proposed, which is using the euro to hedge a diversified portfolio of emerging market currencies.
Model-Based Best Longs / Best Shorts
- The list of underperformers based purely on my models in the attached FX Dashboard pdf stayed unchanged with Taiwan dollar (TWD), Israeli shekel (ILS), Chinese yuan (CNY), Malaysian ringgit (MYR), Korean won (KRW), and Hungarian forint against the euro (EURHUF) on it.
- From the list of outperformers, I removed Brazilian real (BRL) as its z-score receded, leaving it empty.
Model-Based Best Crosses
- The list of the preferred relative-value trades based purely on my models changed to Short BRL vs Long Japanese yen (JPY) or Hungarian forint (HUF) or Polish zloty (PLN) or Czech koruna (CZK) or TWD.
- The 3m expected returns for these pairs are in the high range of 11-15% (not annualized), assuming mean reversion.

Gautam Jain
Estrategista - Ph.D, CFA
New York, EUA
Aviso legal
DISCLAIMER: Este Relatório de Análise foi elaborado e distribuído pelo Analista, signatário unicamente para uso do destinatário original, de acordo com todas as exigências previstas na Resolução CVM nº 20 de 26 de fevereiro de 2021 e tem como objetivo fornecer informações que possam auxiliar o investidor a tomar sua própria decisão de investimento, não constituindo qualquer tipo de oferta ou solicitação de compra e/ou venda de qualquer produto. As decisões de investimentos e estratégias financeiras devem ser realizadas pelo próprio leitor, os Analistas, ou a OHMRESEARCH não se responsabilizam por elas. Os produtos apresentados neste relatório podem não ser adequados para todos os tipos de investidores. Antes de qualquer decisão de investimentos, os investidores deverão realizar o processo de suitability no agente de distribuição de sua confiança e confirmar se os produtos apresentados são indicados para o seu perfil de investidor. A rentabilidade de produtos financeiros pode apresentar variações e seu preço ou valor pode aumentar ou diminuir num curto espaço de tempo. Os desempenhos anteriores não são necessariamente indicativos de resultados futuros. A rentabilidade divulgada não é líquida de impostos. As informações presentes neste material são baseadas em simulações e os resultados reais poderão ser significativamente diferentes.
O(s) signatário(s) deste relatório declara(m) que as recomendações refletem única e exclusivamente suas análises e opiniões pessoais, que foram produzidas de forma totalmente independente e que a OHMRESEARCH não tem qualquer gerência sobre este conteúdo. As opiniões aqui expressas estão sujeitas a modificações sem aviso prévio em decorrência de alterações nas condições de mercado. O Analista responsável pelo conteúdo deste relatório e pelo cumprimento da Resolução CVM nº 20/21 está indicado acima, sendo que, caso constem a indicação de mais um analista no relatório, o responsável será o primeiro analista credenciado a ser mencionado no relatório. Os analistas cadastrados na OHMRESEARCH estão obrigados ao cumprimento de todas as regras previstas no Código de Conduta da APIMEC para o Analista de Valores Mobiliários e no Manual de Controles Internos para Elaboração e Publicação de Relatórios da OHMRESEARCH. De acordo com o art. 21 da Resolução CVM nº 20/21 caso o Analista esteja em situação que possa afetar a imparcialidade do relatório ou que configure ou possa configurar conflito de interesse, este fato deverá estar explicitado no campo “Conflitos de Interesse” deste relatório.
O conteúdo deste relatório é de propriedade única do Analista signatário e não pode ser copiado, reproduzido ou distribuído, no todo ou em parte, a terceiros, sem prévia e expressa autorização deste Analista. Todas as informações utilizadas neste documento foram redigidas com base em informações públicas, de fontes consideradas fidedignas. Embora tenham sido tomadas todas as medidas razoáveis para assegurar que as informações aqui contidas não são incertas ou equívocas no momento de sua publicação, o Analista não responde pela veracidade das informações do conteúdo.
Para maiores informações, pode-se ler a Resolução CVM nº 20/21 e o Código de Conduta da APIMEC para o Analista de Valores Mobiliários. Este relatório é destinado exclusivamente ao assinante da OHMRESEARCH que o contratou. A sua reprodução ou distribuição não autorizada, sob qualquer forma, no todo ou em parte, implicará em sanções cíveis e criminais cabíveis, incluindo a obrigação de reparação de todas as perdas e danos causados, nos termos da Lei nº 9.610/98 e de outras aplicáveis.