Resumo do Relatório
FX Dashboard: How Well is Hedging EM Currencies with the Euro Working?
 (1 votes, average: 5,00 out of 5)
You need to be a registered member to rate this.
In the note Revisiting the US Dollar View and Its Implications for EM Currencies last week, I outlined the reasoning behind my view that the dollar is likely to remain strong in the near term. In line with this view, the two trading themes that I suggest for EM currencies are:
- Beta-neutral relative-value trades: As the dollar has strengthened, EM currencies have weakened although they sold off by less than expected on a combination of cheap valuations and high carry. More importantly, there has been a fair bit of dispersion in their performances. As such, while the overall environment may not be supportive of EM currencies, it is conducive for relative-value trades to capitalize on differences across countries based on macroeconomic, political, and geopolitical developments.
- Hedge a diversified portfolio of EM currencies with the euro: I have been recommending a euro (EUR) hedge for a diversified portfolio of EM currencies since September-end, which has performed well, especially in recent weeks. I recommend maintaining the hedge because the euro will react similarly or possibly worse than EM currencies if the recession risk – which is one of the main headwinds to risky assets – plays out.
In this note, I elaborate on the latter of the two strategies discussed above in line with the analysis in Value of Euro as a Hedge for EM Currencies in Times Like These. Specifically:
- The euro has worked well as a hedge
- Overall, EM currencies have tracked the euro closely on a beta-adjusted basis as the first chart below shows. Indeed, the hedge has outperformed the sell-off in EM currencies of late – i.e., the euro has sold off more quickly – to produce a positive return while lowering the volatility of the portfolio considerably once it is overlaid with the hedge as the second chart below shows
- The carry for EM currencies has been quite high on the back of aggressive rate hikes by the central banks in Latin American and CEEMEA countries. The negative implied yield of the euro hedge adds to the carry of EM currencies, albeit only marginally.
- The correlation between EM FX and the euro has picked up sharply to take it close to its decade highs after dropping below the long-term average at the end of last year – see the third chart below. The correlations across risky assets increase during periods of risk aversion, which has been playing out over the past couple of months. An additional reason for the high correlation is the rising risk of recession, which if it were to materialize would impact the global economy across developed and emerging countries.
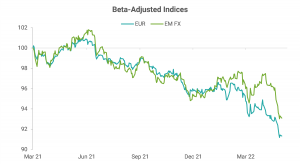
Data Source: Refinitiv; Note: EM FX = equally weighted index of spot returns of 21 currencies excluding Russian ruble

Data Source: Refinitiv; Note: EM FX = equally weighted index of spot returns of 21 currencies excluding Russian ruble

Data Source: Refinitiv; Note: EM FX = equally weighted index of spot returns of 21 currencies excluding Russian ruble
- We can corroborate based on the hedged return
- The spot return for a portfolio of 21 EM currencies equally weighted (excluding the Russian ruble (RUB)) has been -4% since my recommendation at the end of September for the euro hedge. To this, when we add the approximate annual carry of 5.9% for this basket of EM currencies, the total return over the 7-month period is -0.6%.
- EUR had a spot return of -11% during this period, which combined with its annual carry of -0.5%, implies that the total return was -11.3% during this period.
- The beta of this portfolio of EM FX with EUR is 1.5x. In other words, the ratio for EM FX: EUR is 1: 0.65. The hedge consisting of a short position in EUR would have thus added 7.3% to the portfolio’s total return.
- Combining the -0.6% return of the portfolio of EM FX with 7.3% from the hedge implies that the total return for the hedged portfolio would have been +6.7%, which is quite high as it was supported by the euro hedge and high carry of EM currencies. Excluding the carry, the portfolio’s spot return would have been +3.1%, showing the benefit of the hedge alone. This is quite impressive because the dollar (DXY index) appreciated 10.3% in this period which based on the historical beta of EM FX to DXY of -1 would imply that the expected return was -10.3%.
- What would make me change my view?
- As I discussed in the note cited above, for the dollar to stop strengthening, the volatility of US rates needs to drop as the dollar has been highly correlated with it since 2021 (see the chart below). This is another way of saying that the probability of recession needs to fall and for the market to have more clarity on the tightening path of the US Fed.
- When the volatility of US rates drops, it is likely that the dollar starts weakening since it is very expensive in real effective exchange rate terms. At that time, it will be important to close the euro hedge as it will likely start hurting rather than helping a portfolio of EM currencies as has been the case so far.

Data Source: Refinitiv
Model-Based Best Longs / Best Shorts
- To the list of underperformers based purely on my models in the attached FX Dashboard pdf, I added Hungarian forint against the euro (EURHUF) as its z-score crossed 1.5. Many currencies are currently showing up as cheap in the model which led me to ignore those with z-scores less than 1.5.
- The list already had Taiwan dollar (TWD), Israeli shekel (ILS), Chinese yuan (CNY), Malaysian ringgit (MYR), and Korean won (KRW) on it.
- The list of outperformers remained unchanged with Brazilian real (BRL) on it.
Model-Based Best Crosses
- The list of the preferred relative-value trades based purely on my models expanded to to Short BRL vs Long Hungarian forint (HUF) or Polish zloty (PLN) or Czech koruna (CZK) or TWD or Romanian leu (RON).
- The 3m expected returns for these pairs are in the high range of 11-17% (not annualized), assuming mean reversion.

Gautam Jain
Estrategista - Ph.D, CFA
New York, EUA
Aviso legal
DISCLAIMER: Este Relatório de Análise foi elaborado e distribuído pelo Analista, signatário unicamente para uso do destinatário original, de acordo com todas as exigências previstas na Resolução CVM nº 20 de 26 de fevereiro de 2021 e tem como objetivo fornecer informações que possam auxiliar o investidor a tomar sua própria decisão de investimento, não constituindo qualquer tipo de oferta ou solicitação de compra e/ou venda de qualquer produto. As decisões de investimentos e estratégias financeiras devem ser realizadas pelo próprio leitor, os Analistas, ou a OHMRESEARCH não se responsabilizam por elas. Os produtos apresentados neste relatório podem não ser adequados para todos os tipos de investidores. Antes de qualquer decisão de investimentos, os investidores deverão realizar o processo de suitability no agente de distribuição de sua confiança e confirmar se os produtos apresentados são indicados para o seu perfil de investidor. A rentabilidade de produtos financeiros pode apresentar variações e seu preço ou valor pode aumentar ou diminuir num curto espaço de tempo. Os desempenhos anteriores não são necessariamente indicativos de resultados futuros. A rentabilidade divulgada não é líquida de impostos. As informações presentes neste material são baseadas em simulações e os resultados reais poderão ser significativamente diferentes.
O(s) signatário(s) deste relatório declara(m) que as recomendações refletem única e exclusivamente suas análises e opiniões pessoais, que foram produzidas de forma totalmente independente e que a OHMRESEARCH não tem qualquer gerência sobre este conteúdo. As opiniões aqui expressas estão sujeitas a modificações sem aviso prévio em decorrência de alterações nas condições de mercado. O Analista responsável pelo conteúdo deste relatório e pelo cumprimento da Resolução CVM nº 20/21 está indicado acima, sendo que, caso constem a indicação de mais um analista no relatório, o responsável será o primeiro analista credenciado a ser mencionado no relatório. Os analistas cadastrados na OHMRESEARCH estão obrigados ao cumprimento de todas as regras previstas no Código de Conduta da APIMEC para o Analista de Valores Mobiliários e no Manual de Controles Internos para Elaboração e Publicação de Relatórios da OHMRESEARCH. De acordo com o art. 21 da Resolução CVM nº 20/21 caso o Analista esteja em situação que possa afetar a imparcialidade do relatório ou que configure ou possa configurar conflito de interesse, este fato deverá estar explicitado no campo “Conflitos de Interesse” deste relatório.
O conteúdo deste relatório é de propriedade única do Analista signatário e não pode ser copiado, reproduzido ou distribuído, no todo ou em parte, a terceiros, sem prévia e expressa autorização deste Analista. Todas as informações utilizadas neste documento foram redigidas com base em informações públicas, de fontes consideradas fidedignas. Embora tenham sido tomadas todas as medidas razoáveis para assegurar que as informações aqui contidas não são incertas ou equívocas no momento de sua publicação, o Analista não responde pela veracidade das informações do conteúdo.
Para maiores informações, pode-se ler a Resolução CVM nº 20/21 e o Código de Conduta da APIMEC para o Analista de Valores Mobiliários. Este relatório é destinado exclusivamente ao assinante da OHMRESEARCH que o contratou. A sua reprodução ou distribuição não autorizada, sob qualquer forma, no todo ou em parte, implicará em sanções cíveis e criminais cabíveis, incluindo a obrigação de reparação de todas as perdas e danos causados, nos termos da Lei nº 9.610/98 e de outras aplicáveis.